A question that I’ve had is what is the profile of a successful triathlete. Are they a jack of all trades, or do they specialize in their strength? Take the person who got first place, and relative to their time, were they a better runner or cyclist?
To look at this, I standardized the scores of the swim, bike, run, and overall time. Standardization is important here because comparing a swim time to a bike time is like apples and oranges – a swim time of 60 minutes is really slow and a run time of 60 minutes is impossibly fast! Standardizing all of the variables allows me to say that a swim time of one standard deviation above the mean (55 minutes) is similar to a bike time of one standard deviation above the mean (200 minutes, or 2 hours and 20 minutes). Complicated? Sorry.
The next step I need to explain is how I control for overall time in a tale of two triathletes.
| Swim | Bike | Run | |
| Joe (20th place) | 30:00 | 155:00 | 117:00 |
| Patrick (1st place) | 30:00 | 124:00 | 72:00 |
Joe and Patrick have the same swim time, but Patrick is a whole hour faster than Joe. Joe swam as fast as first place did (Patrick), which is a very impressive feat! Looking at these results will tell us that Joe’s strength is swimming, but he has some weakness on the bike and run. However, we wouldn’t be able to assume that swimming is a relative strength of Patrick. Maybe he is a jack of all trades.
Long story short, I ran a procedure to control for these relative differences in times.
Finally, I ran a two step cluster analysis in SPSS to determine what groups (segments) would organically appear, but I asked it (nicely) no more than nine. Below is a short list of segments based on common strengths we see in the sport.
- Swimmers
- Bikers
- Runners
- Swim-Bikers
- Swim-Runners
- Bike-Runners
- Balanced
The cluster analysis reported back five groups – balanced (weak swim), bikers, runners (weak swim), swimmers, and run-swimmers (weak bike). There might be more/less groups, but they might not have added any additional goodness-of-fit or statistical helpfulness to the data.
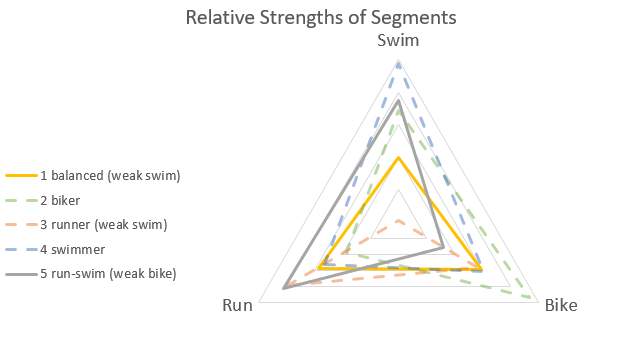
These segments are visualized in the radar chart above where the further the line is from the middle, the better racers are relative to their overall time in that length. Also, the closer to the middle means that it is a relative weakness to their overall time.
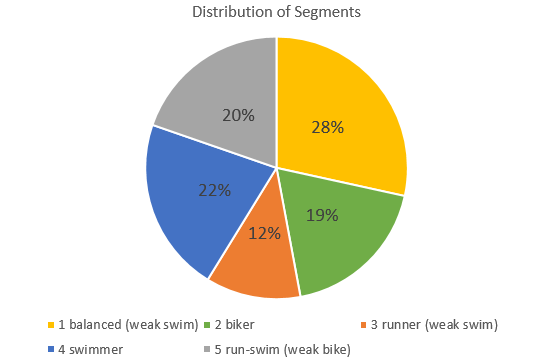
The largest segment is the balanced group at 28% of total racers. These people don’t have any dramatic strengths, but appear to struggle a little with the swim more than we would expect given their overall time on average. The largest single strength group are the swimmers at 22%.
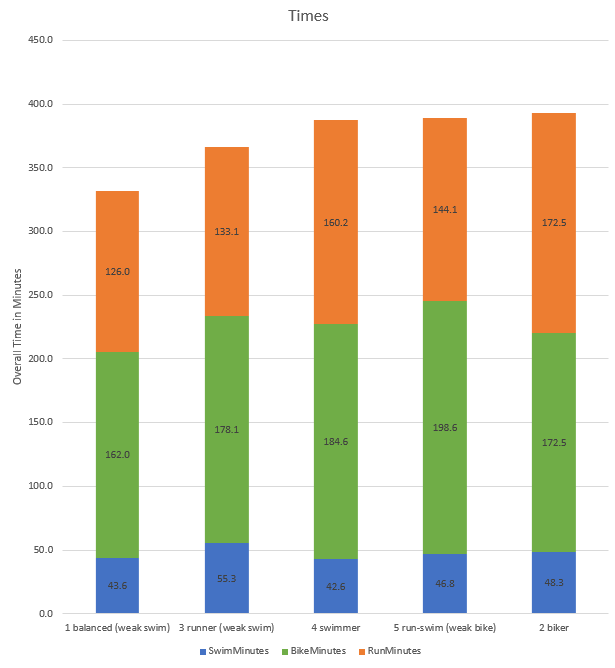
When we look at these groups by segment, we can see that the best triathletes tend to be more balanced on average. What is really interesting is how the swimmer segment has a faster swim time (42 minutes) than the balanced segment (43 minutes). This proves out the reality that the swim portion of a triathlon is the least important in your overall time.
A surprising result is how the bikers are the slowest group on average, but a very common phenomena in a race setting. This group probably goes too hard on the bike, and that leaves them too tried to be competitive on the run giving them the slowest time on average.
