One of my favorite multisport races is the Half Ironman series – one mile swim, 56 mile bike, 13 mile run. It is long enough where nutrition and hydration is important, but short enough where you cannot ease the pace if you want to place well.

After you can finish a Half Ironman, the next step is to try to do it faster and qualify for the championships (usually top 3 get invited). A question I have is what does a successful triathlete look like? Do the best triathletes have one common strength (swim, bike, or run), or do they have no weaknesses? Does the model for success change by age group or gender?

Descriptives show that on average, it takes people 46 minutes to complete the swim, 177 minutes to complete the bike (3 hours), and 146 minutes to complete the run (2 hours and 30 minute) for a total time around 381 minutes (6 hours).
From this we might suspect that since the swim is so short, and the bike is so long, that the swim is the least important length, and the bike is the most important. The swim has less time to lose and the bike has more time to lose, therefor athletes with limited amount of time should emphasize their bike training over their swim training.
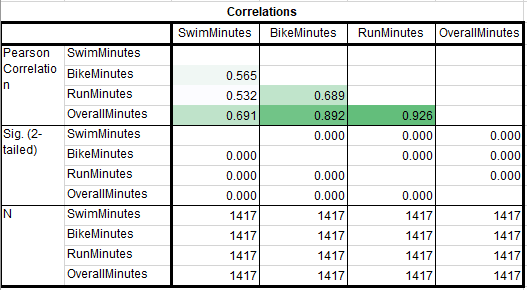
However, if we run correlations between all of the times, the strongest correlation with a racer’s overall time is the amount of minutes spent running (r = .926), followed closely by their bike time (r = .892). Using this data, a data conscious athlete should make sure that they are a slightly better runner than they are a cyclist, and not worry about their swim training as much. But does this pattern hold up for men and women?

Yes, the correlations between overall time and swim, bike, and run times are very similar for men and women. Do we see a difference by division?

Above is a correlation table filtered for only correlations with Overall Minutes. Each row gives me the correlations between the swim, bike, and run with their overall time. This is why OverallMinutes is blank because OverallMinutes correalted with itself is 1.
While there are some groups where the bike time has a higher correlation with overtime than run time, there isn’t a consistent pattern. Like with gender, people in different age groups are more similar than different when it comes to what the athlete needs to do to place well within their division. The swim is the least important, and running is slightly more important that cycling.
A final thought is that does the model for success for someone who wants to do well when they want to finish in under 5 hours the same than someone who wants to finish in under 8 hours?
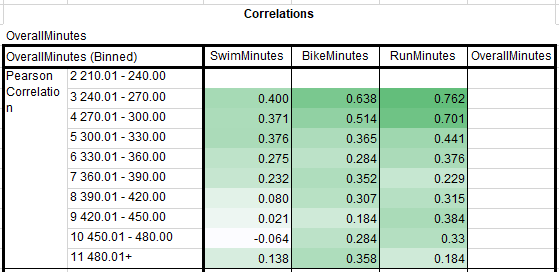
This is another correlation table split into ten groups in 30 minute finish intervals. One person finished in the 210 to 240 minute bucket (3.5 hours to 4 hours), so I cannot calculate the correlations with only one case.
What is interesting is that the relationship between overall time and run time compared to overall and bike time is much more important at the most competitive levels of triathlon. One explanation for this is that going from 21 to 22 mphs on the bike requires exponentially more power than it does to go from 9 mph to 10 mph on the run with air resistance alone. It is very likely that there is an upper limit on bike speed where being a better cyclist has diminishing returns. Since air resistance is less of a factor at lower speeds, like running, this is why doing better on the run has a stronger relationship with overall time for elite athletes.
For athletes who take longer than 360 minutes (6 hours) to finish, the run becomes less important relative to the bike. Going back to air resistance, this is likely because those average triathletes are not racing at speeds where there are diminishing returns for going faster on the bike.
One of the problems with correlations is that they only look at two variables at a time, and don’t give a comprehensive understanding of the relationship between all of the variables. We could run a (least ordinal squares) linear regression that would give us standardized beta weights, but I don’t like that because the interpretation is difficult. I also have nerdy reasons why I don’t like linear regression because it maximizes prediction over interpretation.
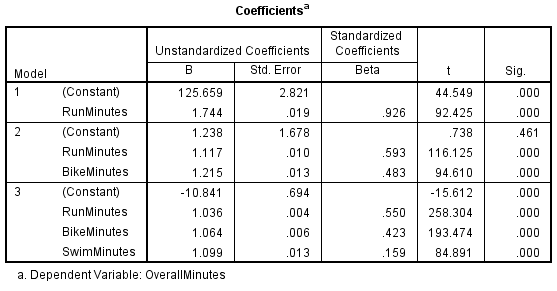
A quick note on why I’m not interested in prediction is because I can just add up a racers swim time, bike time, and run time to get their overall time. What I want to know is which variable is the most important.
An alternative is to run a relative weights linear regression. On a statistical level, it handles the problem of high correlations between your predictors better. The most helpful aspect of a relative weights linear regression model is that all of the variables add up to 100%, pictured below.
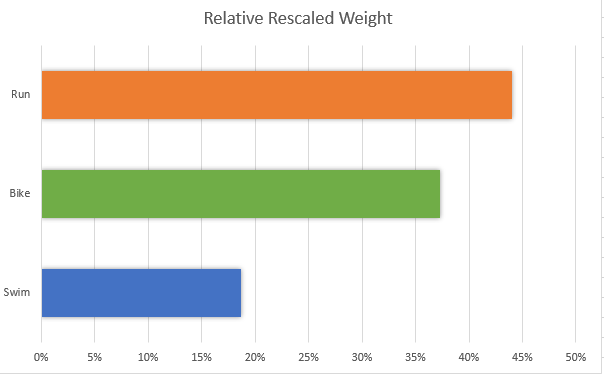
The relative weights model above shows us that running is the most important length in this triathlon, accounting for 44% of the explainable variance. Compare this to the run accounting for an average of 38% of the total time (146 minutes / 381 minutes from the descriptives).
Summary of findings
- Gender differences? More like gender similarities.
- The model for success doesn’t differ by division.
- The more competitive you are, the more important the run is.
- Across many different methods, the run is the most important length to do well in.

